Performance measurements
This page reports measured OpenMP strong scaling, marker-count scaling and
the CPU profile of SIMPLE for a public reactor-scale case, with the commands
to reproduce them. Raw data: strong-scaling.csv, markers64.csv,
markers128.csv, build metadata (commits, compiler flags), run metadata (executable hash, arguments).
Machine, build and case
Machine |
AMD Ryzen 9 5950X (16 cores, 32 hardware threads), 94 GiB RAM, Linux; shared workstation, clocks not locked |
SIMPLE |
|
Dependencies |
libneo |
Compiler |
GCC 16.2.1, CMake 4.4.4, Ninja 1.13.2 |
Build |
Release, OpenMP, |
Equilibrium |
simsopt |
Settings |
|
OpenMP |
|
Each run is a fresh process. Wall time includes setup, sampling, tracing and output; tracing time is SIMPLE’s own timer in the log. Runs are sequential, two repetitions per point.
Strong scaling
256 markers. Speedup is the mean one-thread wall time divided by the mean wall time; efficiency is speedup divided by threads.
Threads |
Wall r1 (s) |
Wall r2 (s) |
Mean wall (s) |
Mean tracing (s) |
Speedup |
Efficiency |
|---|---|---|---|---|---|---|
1 |
297.13 |
257.73 |
277.43 |
271.63 |
1.00 |
100.0 % |
2 |
123.16 |
124.03 |
123.59 |
118.19 |
2.24 |
112.2 % |
4 |
65.76 |
82.23 |
74.00 |
68.71 |
3.75 |
93.7 % |
8 |
37.03 |
46.34 |
41.68 |
33.81 |
6.66 |
83.2 % |
16 |
22.50 |
22.55 |
22.53 |
17.29 |
12.32 |
77.0 % |
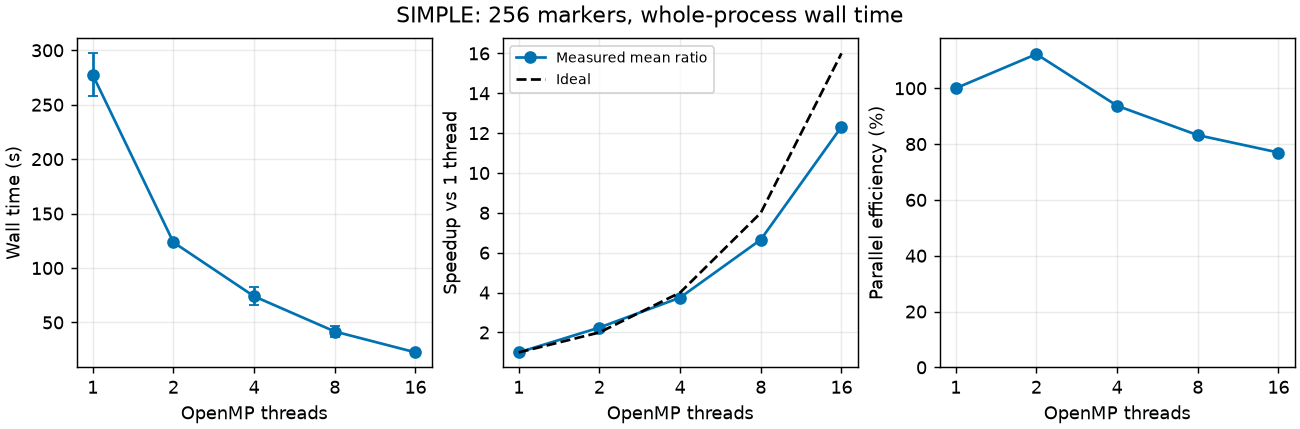
Whole-process strong scaling, 256 markers, QA case; error bars span the two repetitions.
At 16 threads the wall-time speedup is 12.3162 (efficiency 76.9763 %) and
the tracing speedup 15.71 (98.2 %). The difference is the setup of about
5 s, which does not scale. Efficiency above 100 % at two threads and the
spread between repetitions come from the shared machine. All ten runs give
identical times_lost.dat and confinement curves (all 256 markers traced
to 0.01 s, confined fraction 1, no unresolved orbit).
Marker-count scaling
16 threads, same equilibrium, seed and duration. Throughput rises with marker number as the fixed setup is spread over more markers.
Markers |
Wall r1 (s) |
Wall r2 (s) |
Mean wall (s) |
Mean tracing (s) |
Markers per wall second |
|---|---|---|---|---|---|
64 |
9.58 |
9.58 |
9.58 |
4.31 |
6.68 |
128 |
13.89 |
13.89 |
13.89 |
8.64 |
9.22 |
256 |
22.50 |
22.55 |
22.53 |
17.29 |
11.36 |
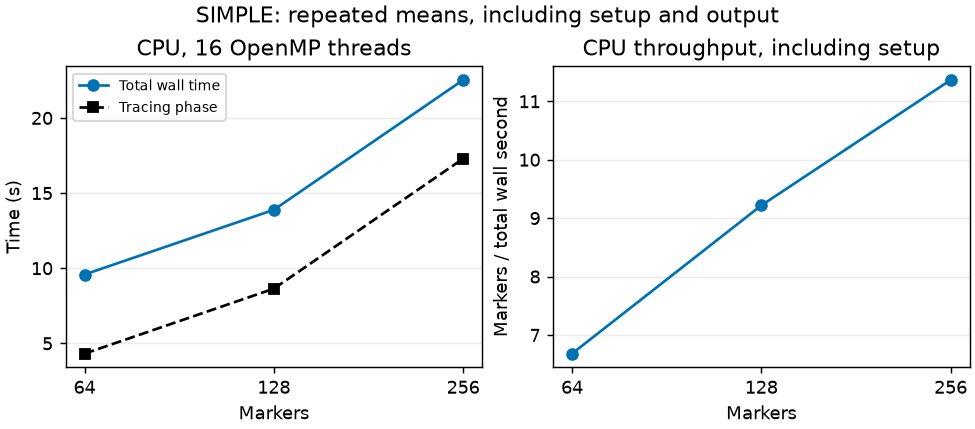
Marker-count scaling at 16 threads, 64 to 256 markers, two runs each.
CPU profile
perf samples of user cycles at 99 Hz (about 27 000 samples) for the
256-marker, 16-thread run. Self shares of sampled cycles:
Function |
Self share |
Source |
|---|---|---|
|
41.20 % |
libneo |
|
11.73 % |
libneo |
|
4.18 % |
libneo |
|
3.71 % |
|
|
2.22 % |
|
Field evaluation by spline derivatives dominates: the two batch spline kernels take 52.93 % of the cycles.
CUDA
No GPU throughput is reported for this case. With the VMEC file as field,
native CUDA stops before the first kernel with native CUDA RK requires
initialized compact Boozer tables (src/simple_cuda_native.f90): the
device tables are built only from a Boozer chartmap. The attempted run used
one NVIDIA RTX 5060 Ti (CUDA 13.4, architecture 120,
gpu_method = 'dopri'); configuration in gpu-metadata.json.
Reproduce
From the repository root (NumPy and Matplotlib needed; the runner refuses to overwrite existing output directories):
export OPENBLAS_NUM_THREADS=1
make CONFIG=Release \
  FLAGS='-DLIBNEO_REF=f6090e8150c2f5b1c0afde09baadf79b50b1ffe7 -DENABLE_PYTHON_INTERFACE=OFF -DSIMPLE_ENABLE_PYTHON_TOOLS=OFF -DSIMPLE_DETERMINISTIC_FP=OFF'
mkdir -p build/evidence
curl -L --fail -o build/evidence/wout.nc \
  'https://raw.githubusercontent.com/hiddenSymmetries/simsopt/81436b4f7c655a4099eadadb168b7cc27923e555/tests/test_files/wout_LandremanPaul2021_QA_reactorScale_lowres_reference.nc'
sha256sum build/evidence/wout.nc
python tools/perf/efss_scaling.py --wout build/evidence/wout.nc \
  --output build/evidence/full-strong256 --markers 256 --threads 16 8 4 2 1
python tools/perf/efss_scaling.py --wout build/evidence/wout.nc \
  --output build/evidence/markers128 --markers 128 --threads 16
python tools/perf/efss_scaling.py --wout build/evidence/wout.nc \
  --output build/evidence/markers64 --markers 64 --threads 16
python tools/perf/plot_efss_scaling.py build/evidence/full-strong256/measurements.csv \
  build/evidence/strong-scaling.png
The runner writes the input of the table above, checks that every marker is
traced (no exit code 3) and that start points, time grid and confinement
curves agree across runs to \(10^{-12}\), and keeps simple.in,
stdout.log and the output files of each run. Profile:
perf record -e cycles:u -F 99 -o build/evidence/cpu-profile.data -- \
  python tools/perf/efss_scaling.py --wout build/evidence/wout.nc \
  --output build/evidence/cpu-profile --markers 256 --threads 16 --repetitions 1
perf report -i build/evidence/cpu-profile.data --stdio --no-children \
  --comms=simple.x --percent-limit 1
For a CUDA build add build-cuda as in Clusters and pass
--executable build-cuda/simple.x --gpu to the runner. Machine-specific
recipes: CINECA Leonardo and Pitagora.